Prepare the Data
In order to populate tables and charts in PowerPoint, we often have to reorganize the data in the workbook first. OfficeReports introduces 3 different methods to help you: Lookup Tables, Lookup Ranges and Linked Ranges. Lookup Tables and -Ranges are 'search' methods and are very well suited for Report Automation. Even if the data is organized a bit different the next reporting period, OfficeReports is still able to 'find' the correct data for the particular tables and charts in PowerPoint.
All 3 concepts look a bit like creating links to other Excel ranges as you can do it in Excel. In Excel this only results in getting the values of the (fixed) linked range. Using OfficeReports the linked range is 'flexible' and will also show the formatting of the linked range, including both font and fill color. In OfficeReports, font and fill colors are very important. These colors can be used to show icons like e.g. arrows in the PowerPoint presentation! You can read more about that here: Color-Driven Icons
We will explain the 3 different concepts here:
Lookup Tables
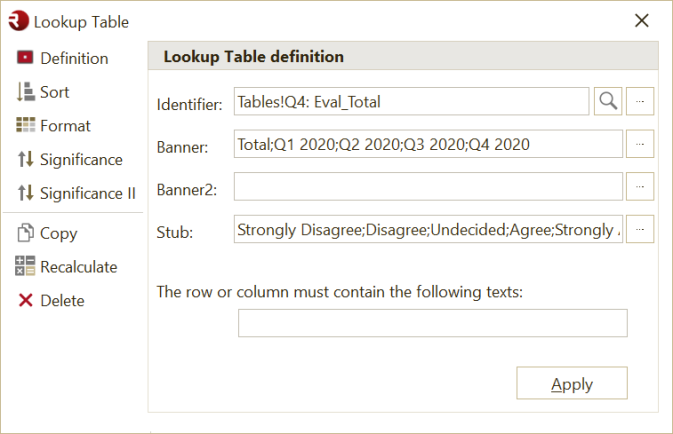
A Lookup Table is created by first searching for the 'identifier'. If the identifier contains a worksheet name before a '!' character, only this worksheet will be searched. From the cell containing the identifier text, OfficeReports will search for cells which have a text of the Banner, the Banner2 (if defined) and the Stub. The Banner, Banner2 and Stub contain search-texts separated by a semicolon. In case multiple cells are found for a combination of these texts, OfficeReports will use the cell containing a percentage value if possible. If one of the cells contains 'significance characters', OfficeReports will be able to use this information in different ways.
SIgnificance
OfficeReports can visualize the significance using background or font colors. To do this you have to define a 'pairwise' comparison in the 'Siginificance' tab by defining a text string containing the significance characters of pairs of columns separated by a semicolon. The significance will be visualized in the first mentioned column. So when comparing "BA;DC", OfficeReports will look if there is significant difference between column A en B and show the significance color in the B column. OfficeReports will also look if there is significant difference between column C en D and show the significance color in the D column.
In case you have to compare more than 2 columns at the same time, it is also possible to show significance characters in the Lookup Table. If you need this for the columns D, E and F and the columns G, H and I, please use the string 'DEF;GHI' in the 'Significance II' tab. In the Lookup Table, OfficeReports will rename all used columns so the table starts with significance character 'A' again.
Lookup Ranges
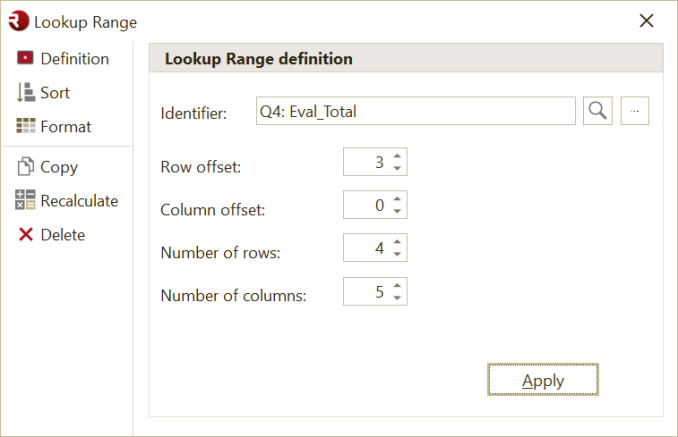
In case we do not have information like Banner and Stub texts, the Lookup Range can select a specific range of cells relative from to the position of the cell where the 'identifier' is found.
Linked Ranges
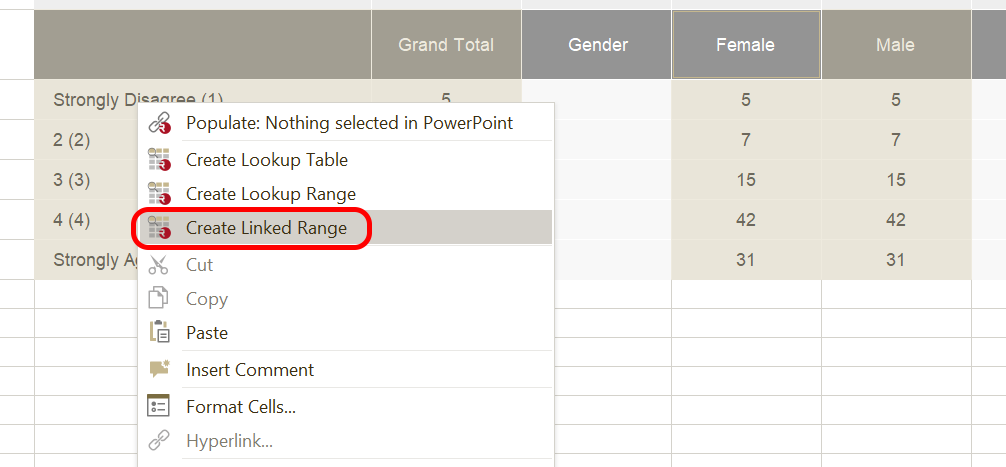
Linked Ranges are created by selecting a specific range in the workbook, and then right-click in the selected range and choose 'Create Linked Range'. Now the cursor will change, and you will have to click the cell where you want the Linked Range. It will be created as soon as you click a cell. The selected range may consist of multiple regions:
Sorting
In all 3 table types we can sort both rows and columns
Formatting